Suunto Blog

Don't miss a turn!
Bike adventurer Sami Sauri is no stranger to navigating on her bike. Currently she is working on guidebooks on gravel rides on the Spanish island of Fuerteventura. She is using komoot to plan the routes and her Suunto 9 to navigate and track them.
”I have several favorite features on komoot. For all users the highlights, that show community generated points of interest, and the way types, that show different surfaces, are some of the main things for planning routes,” Sami says. “And for the premium users the multi-day planner, dynamic weather forecasts and the collections are so good!”
With komoot you can choose and plan where to go either on a desktop or at the trailhead on your mobile device – and sync the planned route to your Suunto for navigation. Read on to learn more!
First things first: establish the connection
To get set up, simply connect your komoot profile with the Suunto app: Go to your profile on Suunto app and select ‘komoot’ under ‘Partner services’. Select ‘Connect with komoot’ and sign into your komoot account and allow requested permissions to connect.
As soon as you have connected the two accounts the sync is automatic both ways: your activities that are tracked with your Suunto are synced to komoot and the routes created on komoot are available on your route library on Suunto app.
Find routes on komoot
You can find a huge collection of pre-planned routes on komoot. You can search activity specific routes in a preferred location, use the routes your friends have shared or check out curated collections of routes for different themes or locations. Some examples of location and activity specific collections are “Best mountain hikes in Haute-Savoie” and Sami's own "Fuerteventura Gravel Route Guide". The themed collections can cover topics like “Long-distance hiking trails”.
Plan your own routes on komoot
First of all, komoot’s route planning is sport specific. When you are planning a route from point A to point B, you are likely to get different results depending on the activity type you choose. For example, for a bike tour you can select between road cycling, bike touring, gravel riding, mountain biking and enduro mountain biking. As the type of riding changes, so does the route it follows.
While planning a route you can view user generated, sport specific highlights on the map that you can include on your route when planning. You can also select POIs, like campgrounds, restaurants etc., to be visible on the map when planning.
Additional nice details include topics like a surface type overview, altitude profile and a dynamic weather forecast: Simply select the time when you want to start your tour and the weather forecast is updated accordingly. That’s quite useful with temperatures in the mountains and wind for a road cycling tour, for example.
Other useful features include sharing route plans with friends, planning multi day itineraries and creating your own route collections.
Navigate with your Suunto
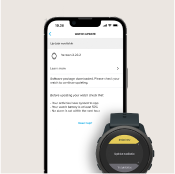
Once you have created a route (called a ‘tour’ in komoot language) it will automatically be synced to your Suunto account. To use it for navigation switch the ‘use in watch’ toggle on and sync your watch with the Suunto app.
A key benefit for creating routes for your Suunto on komoot is turn-by-turn navigation: When navigating, the watch will alert you about an upcoming turn. This makes the navigation experience more enjoyable, as you don’t need to keep an eye on the navigation screen to see which way to take. There is one alert 100 meters before a turn and one at the turn. (komoot's turn alerts are shown on Suunto 9, Suunto 7 and Suunto 5 watches. With Spartan family no direction is shown, there is only an alert that you need to turn.)
You will get a free map region on komoot when you connect your accounts and can start using the turn-by-turn navigation for routes in that region. When buying a new Suunto watch you will get additional two free map regions from komoot as part of Suunto Valuepack!
Learn more about komoot at komoot.com. Multi-day planner, personal collections, on-tour weather, sport-specific maps and worldwide offline maps are komoot premium features.
Action images by Sergio Villalba
Watch now: Getting started with komoot
Read more
Six ways to plan a route for your next adventure

Two friends pursue history on the Eiger
Childhood buddies Philipp Reiter and Martin Schidlowski set off bikepacking from Berchtesgaden in south Germany yesterday following the same historic journey undertaken 85 years ago by German climbers and friends Toni Kurz and Andi Hinterstoisser.
In 1936, early in the Nazi period, Kurz and Hinterstoisser deserted from the German military, and under the cover of darkness began cycling from Berchtesgaden to the base of Eiger in Switzerland, some 600 km away. Their goal? To become the first climbing team to solve the last unsolved climbing problem in the Alps – the sheer, unforgiving North Face of the Eiger (3967 m). However, their climb ended in tragedy, with both climbers, and two Austrian climbers all dying on the wall. The tragic story was captured in the 2008 film, North Face.
“What is cool for me is we will get a little glimpse of an idea of how tough it was and what challenges Kurz and Hinterstoisserand had to face,” Philipp says. “It’s cool to discover how it really was for them.”
The intimidating North Face of Eiger. © Wikimedia Commons User: Terra3 / CC BY-SA 3.0
Philipp and Martin, both Berchtesgaden locals, are undertaking the same journey, with the aim of summitting Eiger via the North Face, to experience firsthand what their compatriots went through. It will take them three days to cycle 600 km, with 6000 m of vertical gain, to reach Grindelwald Valley and the base of the face where they will attempt the 1600 m vertical climb.
A snow dump made the first day a tough ride. @ Nicolas Holtzmeyer
Philipp, a photographer, alpinist and history enthusiast, and Martin, a climber and mountain guide, have been friends since childhood, and having been going on adventures together since 2006. Each year they try to share one adventure that combines endurance and mountaineering.
“Martin is totally not into biking,” Philipp says. “I’m more experienced with biking, and he’s expert in climbing. We make a good team. He’s afraid of the long bike ride, and I’m afraid of the challenging climb. This will be my biggest alpine project. It’s 1600 m straight up!”
The two friends will track their journey with Suunto watches and provide live updates via Suunto Instagram. @ Nicolas Holtzmeyer
This isn’t the first history focused adventure Philipp has initiated. In 2020, he and some friends did a relay run of the 850 km front line where Austrian and Italian troops battled during the First World War. In 2019, Philipp and his friends did the same on the 1400 km border that once divided Germany.
“Back in 1936 it was the Germans against the Austrians, and the Austrians against the Italians,” Philipp continues. “Climbing teams from each country wanted to become the first to scale the North Face. It created a super big hype, like the equivalant of a Superbowl TV broadcast.”
Philipp and Martin won’t have to cope with any competition or a medic circus, but a Bavarian television crew will follow them to document the historic journey. You can follow them on Suunto Instagram!

Training Stress Score in Suunto app
Training load is an essential metric of goal-oriented training. Gradually increasing load will improve fitness and performance. Suunto app quantifies training load using Training Peaks’ Training Stress Score, also known as TSS.
The idea of quantifying training stress was first introduced by E.W. Banister and his research colleagues in 1975. Their model is called “Training Impulse'' (TRIMP). TRIMP is calculated using heart rate and duration: a short but intense workout got a higher score than a longer, easier workout.
Since then several different training load models with the same basic principle have been developed: Quantify the training load by taking into consideration the workout duration and intensity.
The most well-known training load metric is Training Peaks’ Training Stress Score, TSS™. Also Suunto app uses TSS to quantify training load. TSS is calculated based on duration and power-based intensity. (When calculating intensity, anaerobic threshold power, normalised power and intensity factor are taken into account. Learn more about the details here.)
To get a better understanding of the TSS values, it is good to know that a one-hour time trial effort equals 100 TSS. At the same time a three-hour easy bike ride can accumulate the same amount of training stress. As said before, the value always depends on the intensity and duration of the effort.
TSS can be based on power, pace or heart rate
While TSS is originally calculated based on anaerobic threshold power, it can also be based on threshold heart rate or threshold running pace. The suitable TSS calculation method depends on the activity type and data available. Suunto app chooses the method and calculates the TSS automatically. Usually heart rate data is used, but in activities like running and swimming TSS is calculated based on threshold pace and in cycling threshold power.
If there are no measurements available, then Suunto app calculates TSS based on a statistical MET (metabolic equivalent) value. The MET based calculation only considers the duration and the activity type and gives a very rough approximation of the TSS. In order to get good quality TSS metrics, use Suunto heart rate, power or pace.
TSS values in Suunto app
TSS (r) –- Running pace
TSS (hr) – Heart rate
TSS (p) – Power
TSS (s) – Swimming pace
TSS (met) – MET base
TSS- – user has edited the value manually
Correct anaerobic threshold is key
Since TSS is based on workout intensity, your intensity zones need to be correctly set up in your Suunto watch. Suunto has five different zones where the upper limit of zone 4 should be your anaerobic threshold. The default zones in your watch are based on heart rate, but you can also set up advanced zones for running (based on heart rate or pace) and cycling (based on heart rate or power). Adjust your intensity zones on your Suunto 3, Suunto 5 or Suunto 9 at ‘Settings’ -> ‘Training’ -> ‘Intensity zones’.
There are basically three ways to define your heart rate zones: an estimate based on your max heart rate, a field test and a lab test. Learn more about intensity zones and about defining them in this article.
TSS quantifies also the long-term training load
When each of your workouts has a Training Stress Score calculated, long term values can be derived from this. Suunto app Diary’s ‘Progress’ view tracks your training load over time and helps you keep your training in balance – whether that means progress, maintaining your fitness or avoiding over-training.
You will be able to see the long-term load as Cumulative Training Load (CTL) and short-term load as Acute Training Load (ATL). When your CTL and ATL are compared, you will get Training Stress Balance (TSB) that helps you follow changes in your freshness or “form”. Learn more about long-term training load analyses here.
Read more
Training with TSS and hrTSS
Understand and manage your training load with Suunto app
3 TrainingPeaks training metrics to adjust your running on the go
View TSS and other power-based cycling metrics in real-time
Figure out your training zones
Reference
E.W. Banister, T.W. Calvert, M.V. Savage, T. Bach. A systems model of training for athletic performance. Australian Journal of Sports Medicine, (1975) 7:57-61.
Lead image: © Matti Bernitz/Suunto

Understand and manage your training load with Suunto
Suunto app’s long-term analysis view tracks your training load and helps you stay in balance – whether that means progress, maintaining your fitness and avoiding over-training. Here are four scenarios to help you understand the graphs.
The key aspect of progressing in your fitness is your ability to increase your training load over a longer period of time. The variables you can play with are training frequency, duration and intensity. With long-term analysis tools powered by TrainingPeaks you can now manage your training better than ever.
To get started with the graphs it is important to understand the basics: Every workout gets a Training Stress Score (TSS) that is based on the intensity and duration of the workout. That’s the base for calculating training load for both short and long-time averages.
Training Stress Score (TSS) is based on your anaerobic threshold power, but it can also be calculated based on your threshold heart rate or your threshold running pace. You can learn more about TSS values here.
These single activities with their automatically calculated TSS values are then used to show your long-term training load. This long-term load is called Chronic Training Load (CTL) or simply “Fitness”. It is a 42-day weighted average of your TSS. The more you train – the more TSS you accumulate in your training – the higher your fitness is.
While your long-term load is shown as “Fitness”, the short-term training load is called “Fatigue” or Acute Training Load (ATL). Fatigue is a 7-day weighted average of your TSS. When increasing training load your fatigue increases faster than fitness.
These two values, fitness and fatigue, are shown in the upper graph in your Suunto app’s Diary’s ‘Progress’ view. The lower graph shows your “Form”, or Training Stress Balance. Form is basically the difference between long-term, chronic training load (CTL) and short-term, acute training load (ATL). This graph helps you understand if you are training in a way that is progressive or not. Too much load and you are too tired, too little and you are not moving forward.
In Suunto app the Form graph is divided into four areas: losing fitness, maintaining fitness, productive training and going too hard.
When your long-term, chronic training load is quite a bit higher than your acute, short-term load, you will start to lose fitness. Short-term hitting this area is good, for example when you want to be fresh for a race. However, training easier than you are used to for a longer time, will lead you to losing your fitness.
When your current training is roughly in balance with what you are used to doing, you’ll be maintaining your fitness. To improve, add variety and load in your training.
Adding more load will take you to the productive training phase: your fitness and fatigue are increasing in a manageable way. This means you are adding load but not too much compared to what you are used to doing.
If you push too hard and add a lot of training stress compared to your long-term load, your form will drop. This will increase risk of illness and injury and hinder your improvements. Take a step back and allow your body to recover.
Adjust the time frame
When viewing the long-term analyses graphs, you can change the time perspective. Really long-term trends can be seen in the yearly view, that shows the latest four years of your training. In the monthly view you will see the latest 13 months and can easily compare your loads to a year ago, for example. The weekly view with the latest 26 weeks and the daily view with the latest 41 days are more appropriate for managing your current training loads.
If you want to plan your training and see how the graphs will evolve, you can do that with TrainingPeaks’ Performance Management Chart. The activities you track with your Suunto can be automatically synced to TrainingPeaks so you can also use their advanced tools for managing and planning your training. As part of Suunto Value Pack you can get 30 days of TrainingPeaks Premium for free.
Four examples of training load
To make it easier for you to understand what to look for in the graphs, here are four different scenarios:
Example 1: Overload
This graph shows the impacts of a two-week training camp: The training load increases quickly, and at the same time the training stress balance drops very low. In this case the CTL before the camp was 66 and was pushed to 93. At the same time the training stress balance dropped to -79. These low numbers increase the risk of illness and injury.
In this case, the training camp was followed by a recovery week that brought the training stress balance close to zero. Chronic training load still remained at an elevated level (close to 90), so the training camp had a positive impact on this athlete’s fitness.
Example 2: Race
In this graph race preparation is going nicely: The long-term training load is increasing over a long period of time meaning “fitness” is getting better. As the event gets closer, training gets lighter, fatigue goes down and the training stress balance, “form” goes up. The athlete is fresh for the big day.
Example 3: Illness
This graph illustrates the effects of an illness (or other break in training). At first training is going smoothly as CTL is ramping up, but then training stops for one week. ATL goes down quickly and also CTL gets lower. After the break the athlete starts training again gently. It takes about three weeks before her CTL/Fitness starts to be close to the same level she had before the break in training.
Example 4: Normal
This graph illustrates what quite a typical training load graph for an active person may look like: The long-term load is on a fairly good level, but not ramping up. To improve fitness, one needs to add load.
Read more
Training with TSS and hrTSS
Training stress score in Suunto app
3 TrainingPeaks training metrics to adjust your running on the go
View TSS and other power-based cycling metrics in real-time
Figure out your training zones
Main image: © Roger Salanova / Suunto

Emil Johansson’s long road to recovery
Swedish Slopestyle mountain biker and Suunto athlete Emil Johansson, 21, is most at home defying gravity with his incredible aerial moves. He started riding bikes at eight and 10 years later became the youngest free ride mountain biking world champion in history.
Slopestyle is a specific discipline of mountain biking which combines a lot of airtime with spectacular tricks. It’s similar to free skiing, just with a bike. Emil stunned the world with his talent at a young age.
Emil’s meteoric rise to the top of the sport hit a wall in 2018 and 2019 because he battled injuries and a mysterious autoimmune disease. The disease remained a mystery for some time, with no clear diagnosis, until Emil met Dr. Bachmann, Dr. Jacob and his trainer Lenz Westner, all based in Munich.
“Before I got diagnosed, I didn’t know what was going on,” Emil says. “I wondered why it was happening to me, over and over again? Why am I getting sick and why am I feeling miserable? It’s hard for me to stay healthy while training hard and it’s tough mentally to be comfortable with taking a step back, thinking about my future, rather than just riding flat out all the time.”
Once he was diagnosed, Emil used his Suunto watch to carefully monitor his state of health so he could better understand what was good for his body and mind. The data provided by the watch supported Emil’s rehabilitation and his road back to health and elite competition. After getting the right treatment and knowing what’s good for him, Emil came back stronger than before.
Emil is famous for his dedication and the hard work he puts into his life as a pro athlete. And like many pro athletes, he has tended to push too hard. “I often overtrained my body in the past with lots of sessions both on and off the bike, so I’ve started using my Suunto watch a long time ago to avoid this,” Emil says. “I felt it was the best way for me to get a second opinion on the condition of my body.”
The Slopestyle champion’s Suunto tells him where he is at with his sleep, recovery and heart rate variability. This helps him stay balanced, train efficiently and remain at the top of the sport. “Whatever I am doing, whether it’s gym training, trail riding, cross country skiing or something else, I always wear my Suunto 9 watch as a kind of silent observer of my health and recovery state,” Emil says.
All images by: © Niklas Wallner

Peak experiences are here and now
American photographer and artist Chris Burkard travels the world documenting amazing people, places and events. Recently he was visiting Iceland, a country he adores, to go on a bikepacking adventure. But life had other plans. A volcano erupted, and Chris knew it was a once in a lifetime opportunity to capture this incredible force of nature. It didn’t disappoint.
Press play to watch the power of nature!
What he witnessed blew his mind and got him reflecting on peak experiences, those almost altered states of consciousness characterised by euphoria and wonder. “I was just so honored to experience it,” he says.
We caught up with Chris and asked him about the experience and what he’s learned about peak experiences through his years of travelling the world and witnessing incredible things.
Do you often travel to Iceland?
I do! In fact I have been there 43 times. In some ways it's an obsession and I think what draws me there the most is the landscape as it’s so visceral and ever changing. But honestly, it's the people that keep me coming back and that keep me engaged and interested.
How did you feel standing so close to a live volcano?
Oddly enough I truly felt at home. At peace.. Like it's something I have been doing for thousands of years. In many ways it felt incredibly calming.
You mention peak experiences in your Instagram post – I imagine your work has brought you many – do these happen by chance or are there things, in your experience, we can do to invite them to occur?
I think that a “peak” experience is the byproduct of the time you put in. You realize at a certain point that to truly experience the height of something you need to slow down, be patient and really recognize when a moment is special. Sometimes a peak moment won't slap you in the face or excite you right away. You realize it later. It sort of dawns on you. I like to give myself the time and patience to recognize these moments. Rarely, when I do recognize them in “real time” it can feel really special.
What does a peak experience feel like to you?
It's a moment when your mind and heart and body are all in sync, it’s the certainty of knowing that there is no other place on Earth that I should be right now.
Do your peak experiences only occur in epic situations like your visit to the volcano, or, say, while surfing a perfect wave, or can they also occur in everyday life?
Everyday life. With my kids, at my property. On my bike commute. It's just the knowledge that a moment is special, will rarely be repeated, and you sort of get a glimpse of the future. And realize I need to cherish this.
You talk about the importance of giving yourself the space to experience before shooting – how do you personally approach this?
Honestly in some ways it kind of sounds like voodoo, but I truly feel like the way to really experience a place is to make an offering. An offering of time and interest and engagement. Not hiding from its many moods and feelings. Its storms and high winds. That is how you find a connection. You have to go through those things to really feel a place. I firmly believe that if you invest that time into a place and put in that effort, you are rewarded.
All images: © Chris Burkard
